We analyzed 157 native museum apps in Germany and Austria. By combining publicly available download numbers with stated annual visitor numbers, we estimated the pickup rate for each app. Our analysis revealed that 90% of museum apps are used by less than 3% of visitors.
This analysis highlights a systemic problem, not individual shortcomings. For well over 15 years, there has been a trend of producing overly customized and technically sophisticated native apps for museums that fail to enhance the digital museum experience and meet visitor needs. This analysis underscores that this is a widespread industry issue.
Museum App Statistics: Data Sources and Visitor Numbers Explained
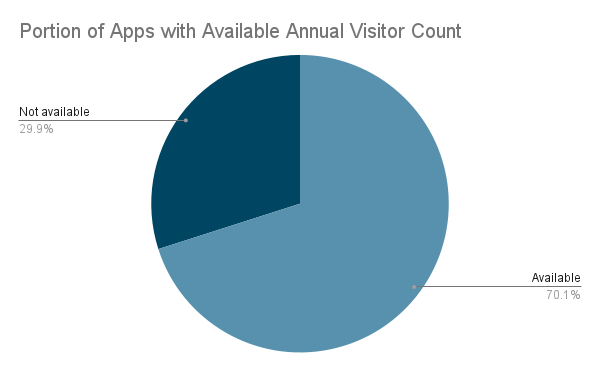
We collected annual visitor numbers for 110 out of 157 museums from reliable public sources, including official museum reports, local newspapers, and government agencies. Unfortunately, due to the unavailability of trustworthy visitor data for the remaining museums, their apps were excluded from our study. Each app in our dataset includes a link to its respective data source.
Museum App Install Data: Estimating iOS Downloads Using Market Share
App install numbers and release dates are publicly available for Android apps on the Google Play Store. For iOS, however, these figures are not disclosed. To compensate for this, we used correction factors based on the mobile phone market share in Europe.
With Android holding approximately 70% of the market and iOS around 30% (source), we applied a correction factor of 1.5x to estimate iPhone user numbers.
Adjusting Museum App Data for COVID-19 Visitor Decline
During the COVID years (2020 & 2021), museums experienced a significant reduction in visitor numbers. In 2020, visitor counts were approximately one-third of 2019 levels, and in 2021, they reached two-thirds of 2019 levels (source). For museum apps that were already available during these years, we need to adjust the number of installs to account for the reduced visitor numbers. This adjustment involves artificially increasing the install count.
First, we must calculate the proportion of days in 2020 and 2021 that the app was actively available. For example, if an app was available from January 1st, 2019, until today (October 1st, 2025), it has been available for 2730 days. We then need to determine the number of days the app was available specifically during 2020 and 2021. Finally, we can increase the number of installs by the ratio of the app’s availability days in 2020 and 2021 to its total availability days.
How we calculated the Museum App Pickup Rate
Using the adjusted install numbers together with the app’s release dates we can compute the average number of downloads per year.
The average number of downloads per year divided by the published annual visitor number gives us the pickup rate per app.
Results: Museum App Pickup Rates Are Strikingly Low:
Over 110 apps the average pickup rate is 1.3%. The highest measured pickup rate is 10.5%.
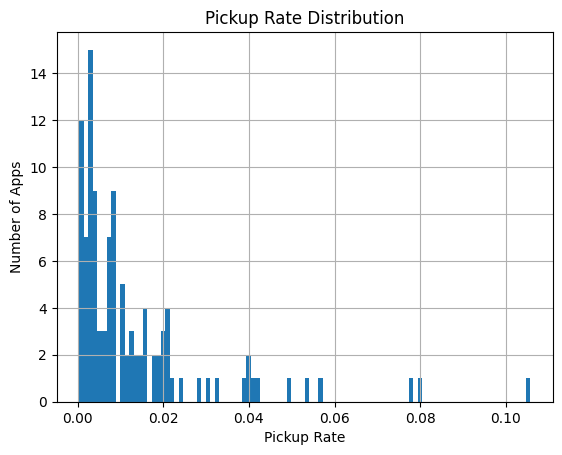
This allows use to make the following statements:
- 90.0% of the apps have a pickup rate of 3% or less.
- 50.0% of the apps have a pickup rate of 1% or less.
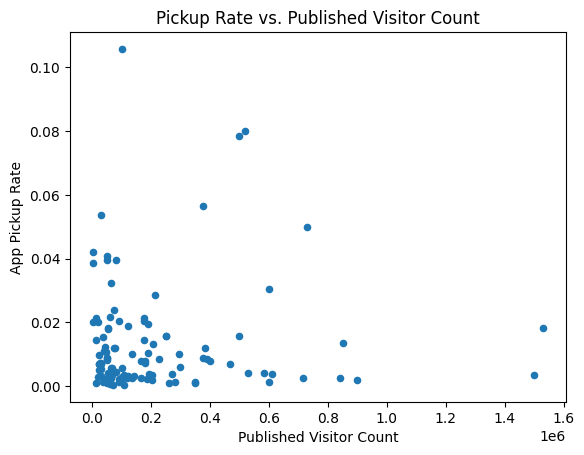
We can see that there is no significant correlation between the pickup rate and the published visitor count. Indicating that the low pickup rates are not exclusive to small or big museums.
Conclusion: Why Native Museum Apps Fail to Engage Visitors
This analysis reveals a critical issue: despite significant investment, native museum apps engage only a tiny fraction of visitors, often less than 3%. Given that a custom native app can cost tens of thousands of euros, along with the ongoing effort for content creation and voice artist recordings, these resources are clearly being misallocated. Such a low adoption rate isn’t just disappointing; it highlights a serious inefficiency in how museums are approaching digital engagement.
How Web Apps Eliminate the Download Barrier for Museum Visitors
One of the primary obstacles to app adoption is the download process itself. Accessibility isn’t solely about physical access to the museum venue; it extends to the digital offerings. Beyond a user-friendly interface, additional barriers like downloading and installing an app from an app store can significantly deter visitors. Unlike native apps, which require platform-specific development for Android and iOS and distribution via their respective stores, web apps eliminate the need for downloads or installations. They work instantly across all devices, often accessible with a simple QR code scan. At nuseum, our web app, called Copilot, is designed for this seamless access, directly reachable via QR codes on visitor tickets and within the exhibition itself.
From Trendy Features to Real Impact: Building Museum Apps That Visitors Actually Use
However, app downloading isn’t the only problem. User reviews frequently point to a lack of quality within the apps themselves. An unintuitive user interface, persistent bugs, and unnecessary features can all contribute to user drop-off. Museum app development, often with good intentions, tends to incorporate the latest technological trends, leading to the inclusion of augmented reality and gamification features. While these are added with the hope of attracting new, often younger, audiences, their actual benefits for visitors are frequently questionable. Our approach at nuseum is different: instead of chasing the newest trends, we focus on what genuinely enhances visitor satisfaction. We help the museum to iteratively adapt their guide based on both qualitative and quantitative visitor feedback, ensuring features deliver real value.
The Last Mile: Why Communication Determines Museum App Success
Even with a high-quality app, communication to the visitor remains a crucial bottleneck. If visitors aren’t aware an app exists, they can’t choose to use it. This is why nuseum acts as a strategic partner for museums, helping them optimize the on-site presentation of the app—through QR codes and direct communication—as well as its online presence. Only through iterative refinement and data-driven decisions can a high pickup rate be achieved. This is an essential step to ensure every visitor has the opportunity to maximize their museum experience.
At nuseum, we believe that the best digital experiences for visitors are created by continuously adapting them based on visitor data and feedback. This agile approach is made possible by the latest developments in AI.
The full dataset cited in this analysis is available here.